


Bitcoin Price Rebounds, But Key Hurdles Could Stall Progress
Bitcoin price started a recovery wave from the $57,200 zone. BTC is rising, but it might struggle to surpass the $60,200 and $61,150 resistance levels. Bitcoin is attempting a recovery wave above the $58,000 support zone. The price is trading above $58,000 and the 100 hourly Simple moving average. There was a break above a connecting bearish trend line with resistance at $58,350 on the hourly chart of the BTC/USD pair (data feed from Kraken). The pair could face heavy resistance at $60,200 or $61,150 in the near term. Bitcoin Price Starts Recovery Bitcoin price extended losses below the $58,500 support levels. BTC even spiked below $57,200. A low was formed at $57,124 and the price recently started a recovery wave. There was a move above the $58,000 and $58,200 resistance levels. It cleared the 50% Fib retracement level of the downward move from the $61,143 swing high to the $57,124 low. There was also a break above a connecting bearish trend line with resistance at $58,350 on the hourly chart of the BTC/USD pair. Bitcoin is now trading above $58,000 and the 100 hourly Simple moving average. On the upside, the price could face resistance near the $60,200 level or the 76.4% Fib retracement level of the downward move from the $61,143 swing high to the $57,124 low. The first key resistance is near the $61,150 level. A clear move above the $61,150 resistance might send the price further higher in the coming sessions. The next key resistance could be $62,000. A close above the $62,000 resistance might spark more upsides. In the stated case, the price could rise and test the $65,000 resistance. Another Decline In BTC? If Bitcoin fails to rise above the $60,200 resistance zone, it could start another decline. Immediate support on the downside is near the $58,750 level. The first major support is $58,500. The next support is now near the $57,200 zone. Any more losses might send the price toward the $56,200 support in the near term. Technical indicators: Hourly MACD – The MACD is now gaining pace in the bullish zone. Hourly RSI (Relative Strength Index) – The RSI for BTC/USD is now above the 50 level. Major Support Levels – $58,750, followed by $58,500. Major Resistance Levels – $60,200, and $61,150.

Bitcoin price started a recovery wave from the $57,200 zone. BTC is rising, but it might struggle to surpass the $60,200 and $61,150 resistance levels.
- Bitcoin is attempting a recovery wave above the $58,000 support zone.
- The price is trading above $58,000 and the 100 hourly Simple moving average.
- There was a break above a connecting bearish trend line with resistance at $58,350 on the hourly chart of the BTC/USD pair (data feed from Kraken).
- The pair could face heavy resistance at $60,200 or $61,150 in the near term.
Bitcoin Price Starts Recovery
Bitcoin price extended losses below the $58,500 support levels. BTC even spiked below $57,200. A low was formed at $57,124 and the price recently started a recovery wave.
There was a move above the $58,000 and $58,200 resistance levels. It cleared the 50% Fib retracement level of the downward move from the $61,143 swing high to the $57,124 low. There was also a break above a connecting bearish trend line with resistance at $58,350 on the hourly chart of the BTC/USD pair.
Bitcoin is now trading above $58,000 and the 100 hourly Simple moving average. On the upside, the price could face resistance near the $60,200 level or the 76.4% Fib retracement level of the downward move from the $61,143 swing high to the $57,124 low.
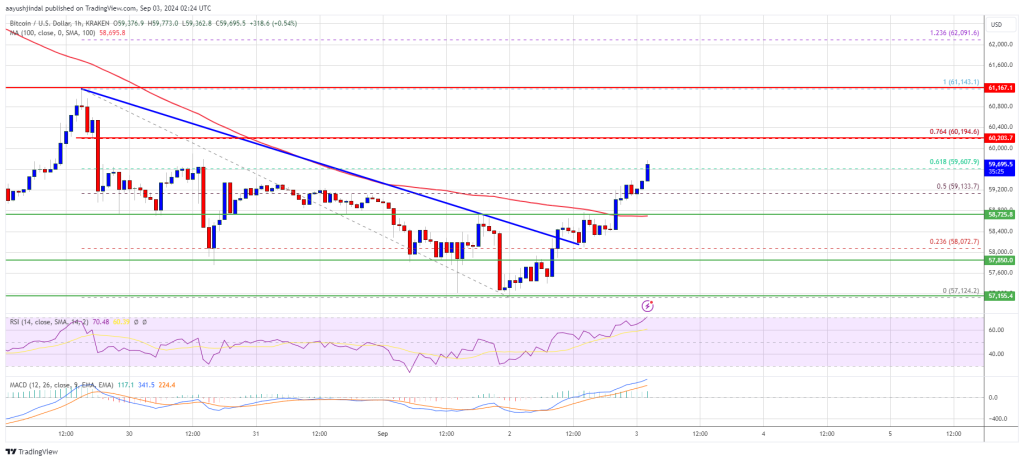
The first key resistance is near the $61,150 level. A clear move above the $61,150 resistance might send the price further higher in the coming sessions. The next key resistance could be $62,000. A close above the $62,000 resistance might spark more upsides. In the stated case, the price could rise and test the $65,000 resistance.
Another Decline In BTC?
If Bitcoin fails to rise above the $60,200 resistance zone, it could start another decline. Immediate support on the downside is near the $58,750 level.
The first major support is $58,500. The next support is now near the $57,200 zone. Any more losses might send the price toward the $56,200 support in the near term.
Technical indicators:
Hourly MACD – The MACD is now gaining pace in the bullish zone.
Hourly RSI (Relative Strength Index) – The RSI for BTC/USD is now above the 50 level.
Major Support Levels – $58,750, followed by $58,500.
Major Resistance Levels – $60,200, and $61,150.
What's Your Reaction?


.gif)