


Bitcoin Uptrend Soon? Dollar Index Breakdown Sparks Optimism Among BTC Bulls
The US dollar index (DXY) is experiencing one of its largest weekly declines since 2013, fuelling optimism for a potential rally among risk-on assets, including Bitcoin (BTC). The last time the DXY saw such a sharp pullback was during the height of the FTX fiasco in November 2022, which coincided with a Bitcoin bottom. Will Bitcoin See An Uptrend? BTC is down nearly 10% over the past two weeks, largely due to the hawkish stance of the US Federal Reserve (Fed) and concerns over trade tariffs from the US against Canada, Mexico, and China. Related Reading: Is Bitcoin Showing Early Signs Of Bullish Divergence? Analyst Explains Since March 3, the DXY has slid more than 3%, tumbling from 107 to 103 at the time of writing. This decline has sparked hope among cryptocurrency investors for a potential rally. Historical data supports this outlook. In addition to the $15,000 BTC bottom formed in November 2022, the DXY has experienced similar sharp declines on two other occasions – during the COVID crash in March 2020 and back in the 2015 bear market when the premier cryptocurrency traded at $250. On all three occasions when the DXY dropped more than -4 standard deviations, BTC formed a bottom followed by a trend reversal that saw the digital asset resume its bullish momentum. Crypto analyst Merlijn The Trader shared their thoughts on the DXY-BTC relationship. In an X post, the analyst noted that whenever the DXY Moving Average Convergence Divergence (MACD) has turned bearish, BTC has rallied. The analyst illustrated this with the following chart. Fellow crypto analyst Rekt Capital had a similar perspective. The analyst emphasized that BTC has likely formed a higher low after another downside deviation, which saw the cryptocurrency hit a low of $78,258 on February 28. Important To Clear The $90,000 Resistance Another crypto trader, Daan Crypto Trader, hinted that BTC may target new all-time highs (ATH) around $120,000 if it continues to consolidate near range lows. The trader explained: We’ve seen this during every consolidation this cycle where it breaks lower, fails to see continuation, retakes the range and moves higher from there. Let’s see how this one turns out. That ~$90K level remains key. Related Reading: As Bitcoin Sell Pressure Fades, Could A Local Bottom Be Forming? Analyst Explains Recent analysis from CryptoQuant supports the view that BTC may have already formed a bottom. Additionally, seasoned crypto analyst Ali Martinez recently highlighted that BTC has hit oversold levels not seen since August 2024, likely signalling a trend reversal in the short-term. That said, BTC is also facing a bearish deviation as it fills a new Chicago Mercantile Exchange (CME) gap, which may dampen hopes for a swift price recovery. At press time, BTC is trading at $86,870, down 3.3% in the past 24 hours. Featured image from Unsplash, charts from X and Tradingview.com

The US dollar index (DXY) is experiencing one of its largest weekly declines since 2013, fuelling optimism for a potential rally among risk-on assets, including Bitcoin (BTC). The last time the DXY saw such a sharp pullback was during the height of the FTX fiasco in November 2022, which coincided with a Bitcoin bottom.
Will Bitcoin See An Uptrend?
BTC is down nearly 10% over the past two weeks, largely due to the hawkish stance of the US Federal Reserve (Fed) and concerns over trade tariffs from the US against Canada, Mexico, and China.
Since March 3, the DXY has slid more than 3%, tumbling from 107 to 103 at the time of writing. This decline has sparked hope among cryptocurrency investors for a potential rally. Historical data supports this outlook.
In addition to the $15,000 BTC bottom formed in November 2022, the DXY has experienced similar sharp declines on two other occasions – during the COVID crash in March 2020 and back in the 2015 bear market when the premier cryptocurrency traded at $250.
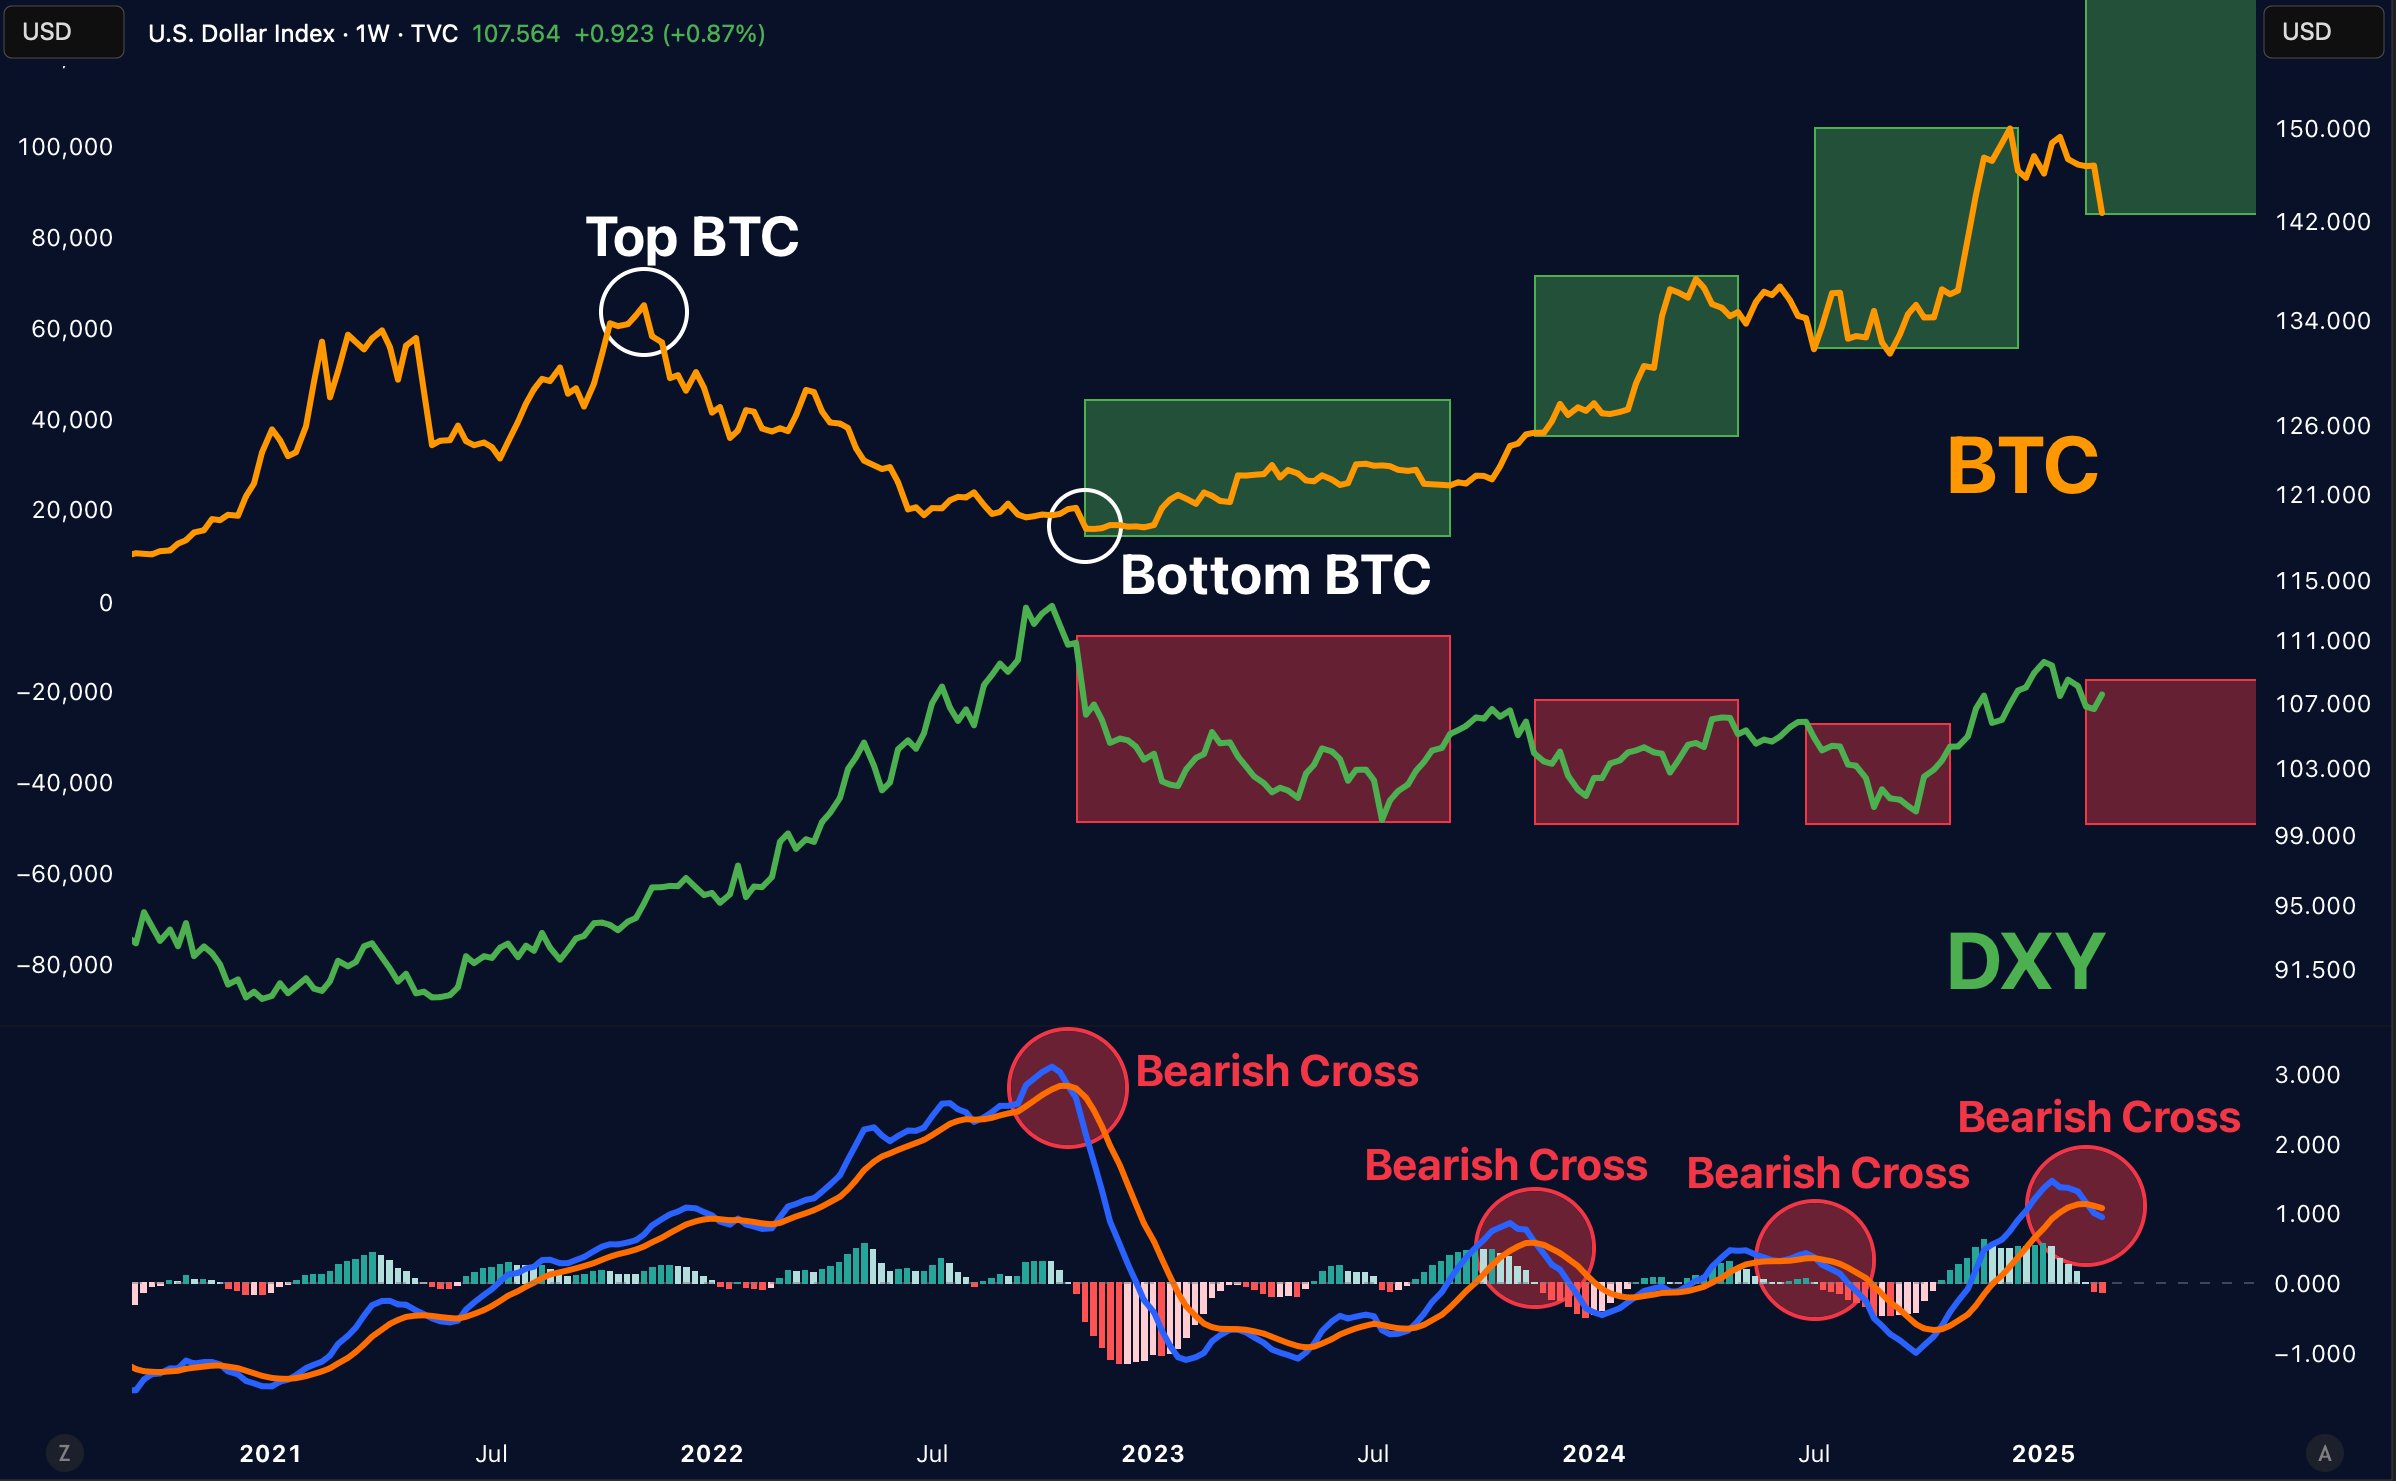
On all three occasions when the DXY dropped more than -4 standard deviations, BTC formed a bottom followed by a trend reversal that saw the digital asset resume its bullish momentum. Crypto analyst Merlijn The Trader shared their thoughts on the DXY-BTC relationship.
In an X post, the analyst noted that whenever the DXY Moving Average Convergence Divergence (MACD) has turned bearish, BTC has rallied. The analyst illustrated this with the following chart.
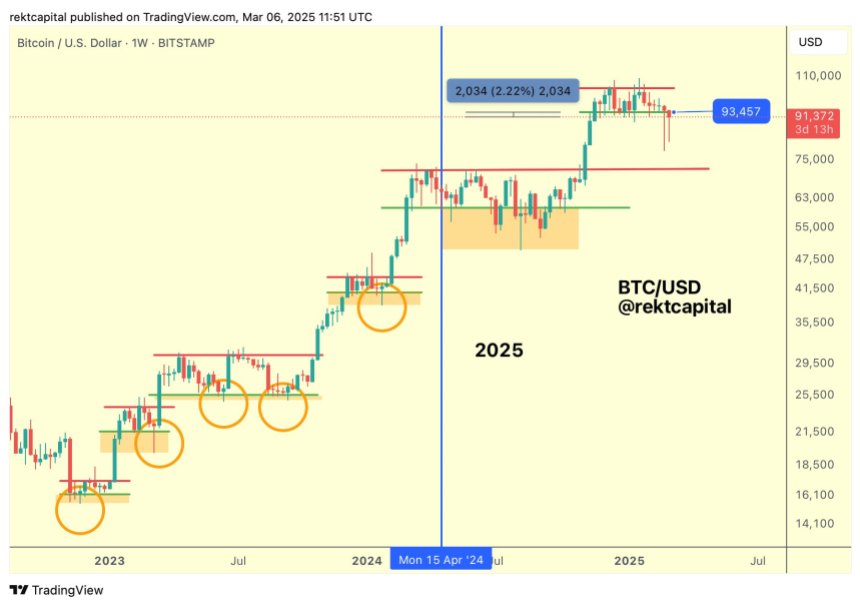
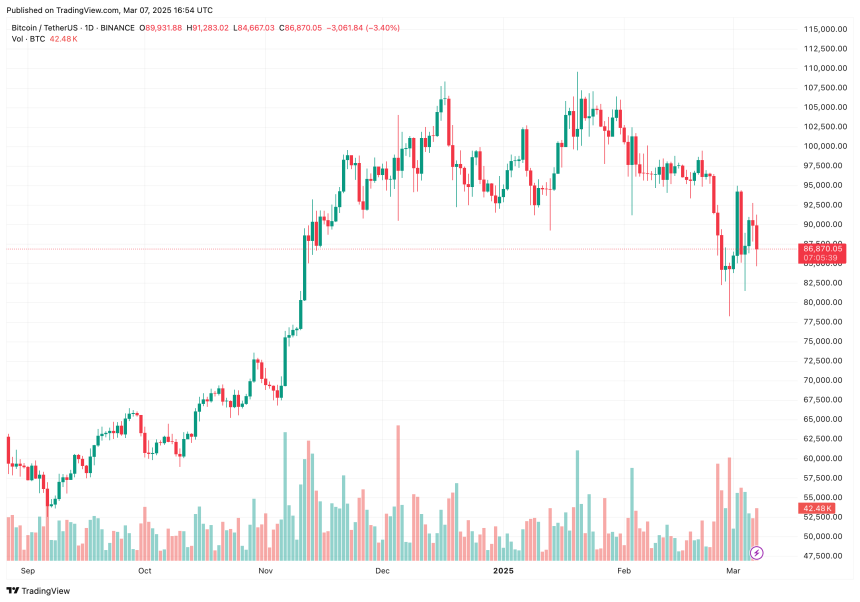
Fellow crypto analyst Rekt Capital had a similar perspective. The analyst emphasized that BTC has likely formed a higher low after another downside deviation, which saw the cryptocurrency hit a low of $78,258 on February 28.
Important To Clear The $90,000 Resistance
Another crypto trader, Daan Crypto Trader, hinted that BTC may target new all-time highs (ATH) around $120,000 if it continues to consolidate near range lows. The trader explained:
We’ve seen this during every consolidation this cycle where it breaks lower, fails to see continuation, retakes the range and moves higher from there. Let’s see how this one turns out. That ~$90K level remains key.
Recent analysis from CryptoQuant supports the view that BTC may have already formed a bottom. Additionally, seasoned crypto analyst Ali Martinez recently highlighted that BTC has hit oversold levels not seen since August 2024, likely signalling a trend reversal in the short-term.
That said, BTC is also facing a bearish deviation as it fills a new Chicago Mercantile Exchange (CME) gap, which may dampen hopes for a swift price recovery. At press time, BTC is trading at $86,870, down 3.3% in the past 24 hours.
What's Your Reaction?


.gif)