


BNB Rally Fades As Price Dips Under $600: Is A Correction Looming?
BNB‘s recent rally appears to be losing steam, as the price has dipped below the crucial $600 mark. After a strong upward surge that reignited bullish sentiment, the momentum is now showing signs of cooling off. This dip raises concerns about whether the rally can sustain itself or if a broader correction is on the horizon. As selling pressure increases and the market cools, this article seeks to explore whether BNB’s rally is losing steam after dipping below the key $600 level. By analyzing technical indicators, market sentiment, and price action, we aim to evaluate the potential for a deeper correction or a renewed bullish push. Current Market Conditions: Analyzing The Position Of BNB Recently, BNB has taken a bearish turn on the 4-hour chart after struggling to break above the significant resistance level of $605. This failure to maintain upward movement has led to a decline, bringing the asset down to the 100-day Simple Moving Average (SMA). Furthermore, a breach below this moving average could intensify selling pressure, while a bounce back might indicate a possible reversal. An analysis of the 4-hour Relative Strength Index (RSI) suggests bullish momentum may wane. Currently, the RSI has fallen to around 36%, indicating that the buying pressure is diminishing. An RSI below 40 can signal that an asset is entering oversold territory, which often precedes further declines or the possibility of a price correction. Related Reading: BNB Price Surge Eyes $550 Breakout: Can It Push Higher? Also, on the daily chart, BNB is exhibiting significant negative movement, as reflected by a series of bearish candlesticks. This ongoing downward trend highlights a prevailing selling pressure within the market. Although BNB is currently trading above the 100-day SMA, which is typically seen as a bullish indicator, the strength of the bearish candlesticks suggests that upward momentum may be limited. Finally, on the 1-day chart, a closer examination of the RSI formation reveals that the RSI signal line has dipped to 53%, approaching the crucial 50% threshold. As the RSI approaches this level, it may heighten the risk of additional declines if it falls below 50, reinforcing the bearish sentiment in the market. Will The 100-Day SMA Hold? Currently, BNB is trading just above the 100-day SMA, which has historically served as a strong indicator of market sentiment. If the price breaks below the 100-day SMA, it could trigger increased selling pressure, leading to an extended drop toward the $531 support level. Related Reading: BNB Price Struggles to Hold $500: Is a Breakout Coming? In the event that BNB maintains its position above the 100-day SMA, it may indicate a potential rebound and restore bullish sentiment, allowing the price to begin climbing back toward the $605 resistance level. A successful breakout above this mark could pave the way for more price growth toward other resistance levels, increasing optimism among traders and signaling a more sustained upward trend. Featured image from Shutterstock, chart from Tradingview.com

BNB‘s recent rally appears to be losing steam, as the price has dipped below the crucial $600 mark. After a strong upward surge that reignited bullish sentiment, the momentum is now showing signs of cooling off. This dip raises concerns about whether the rally can sustain itself or if a broader correction is on the horizon.
As selling pressure increases and the market cools, this article seeks to explore whether BNB’s rally is losing steam after dipping below the key $600 level. By analyzing technical indicators, market sentiment, and price action, we aim to evaluate the potential for a deeper correction or a renewed bullish push.
Current Market Conditions: Analyzing The Position Of BNB
Recently, BNB has taken a bearish turn on the 4-hour chart after struggling to break above the significant resistance level of $605. This failure to maintain upward movement has led to a decline, bringing the asset down to the 100-day Simple Moving Average (SMA). Furthermore, a breach below this moving average could intensify selling pressure, while a bounce back might indicate a possible reversal.
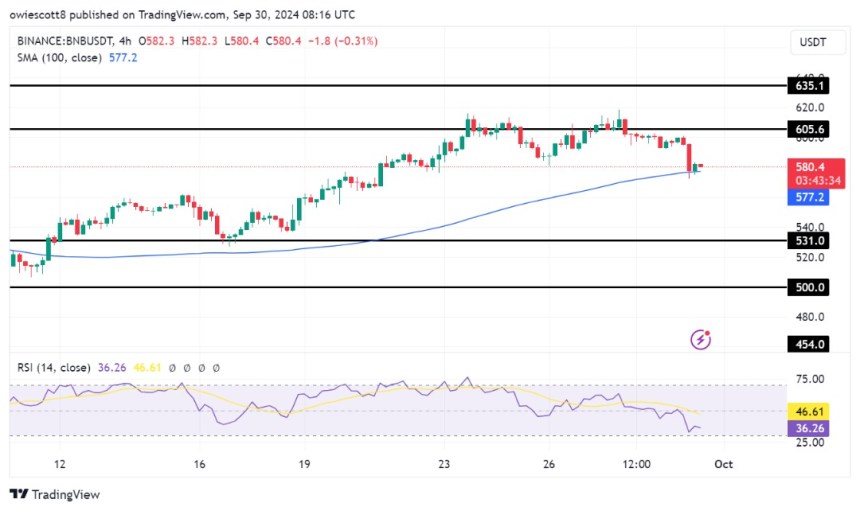
An analysis of the 4-hour Relative Strength Index (RSI) suggests bullish momentum may wane. Currently, the RSI has fallen to around 36%, indicating that the buying pressure is diminishing. An RSI below 40 can signal that an asset is entering oversold territory, which often precedes further declines or the possibility of a price correction.
Also, on the daily chart, BNB is exhibiting significant negative movement, as reflected by a series of bearish candlesticks. This ongoing downward trend highlights a prevailing selling pressure within the market. Although BNB is currently trading above the 100-day SMA, which is typically seen as a bullish indicator, the strength of the bearish candlesticks suggests that upward momentum may be limited.
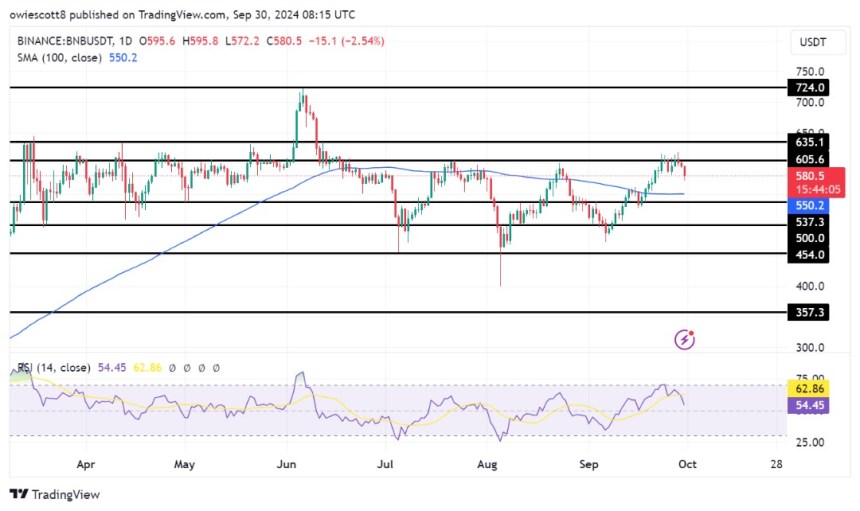
Finally, on the 1-day chart, a closer examination of the RSI formation reveals that the RSI signal line has dipped to 53%, approaching the crucial 50% threshold. As the RSI approaches this level, it may heighten the risk of additional declines if it falls below 50, reinforcing the bearish sentiment in the market.
Will The 100-Day SMA Hold?
Currently, BNB is trading just above the 100-day SMA, which has historically served as a strong indicator of market sentiment. If the price breaks below the 100-day SMA, it could trigger increased selling pressure, leading to an extended drop toward the $531 support level.
In the event that BNB maintains its position above the 100-day SMA, it may indicate a potential rebound and restore bullish sentiment, allowing the price to begin climbing back toward the $605 resistance level. A successful breakout above this mark could pave the way for more price growth toward other resistance levels, increasing optimism among traders and signaling a more sustained upward trend.
What's Your Reaction?


.gif)