


Cardano (ADA) Gains Traction: Is More Upside Ahead?
Cardano price started a decent increase above the $0.340 resistance. ADA is now showing positive signs and might rise further toward $0.380. ADA price started a recovery wave from the $0.3220 level. The price is trading above $0.350 and the 100-hourly simple moving average. There was a break above a key bearish trend line with resistance at $0.3430 on the hourly chart of the ADA/USD pair (data source from Kraken). The pair could continue to move up if it remains stable above the $0.3440 support zone. Cardano Price Starts Steady Increase After forming a base above the $0.330 level, Cardano started a decent increase. There was a decent move above the $0.3350 and $0.340 resistance levels like Bitcoin and Ethereum. There was also a break above a key bearish trend line with resistance at $0.3430 on the hourly chart of the ADA/USD pair. The pair even spiked above $0.350. A high was formed at $0.3587 and the price is now consolidating gains. It is above the 23.6% Fib retracement level of the upward move from the $0.3300 swing low to the $0.3587 high. Cardano price is now trading above $0.350 and the 100-hourly simple moving average. On the upside, the price might face resistance near the $0.3580 zone. The first resistance is near $0.3620. The next key resistance might be $0.3650. If there is a close above the $0.3650 resistance, the price could start a strong rally. In the stated case, the price could rise toward the $0.380 region. Any more gains might call for a move toward $0.400. Are Dips Supported in ADA? If Cardano’s price fails to climb above the $0.3580 resistance level, it could start another decline. Immediate support on the downside is near the $0.350 level. The next major support is near the $0.3440 level or the 50% Fib retracement level of the upward move from the $0.3300 swing low to the $0.3587 high. A downside break below the $0.3440 level could open the doors for a test of $0.330. The next major support is near the $0.320 level where the bulls might emerge. Technical Indicators Hourly MACD – The MACD for ADA/USD is gaining momentum in the bullish zone. Hourly RSI (Relative Strength Index) – The RSI for ADA/USD is now above the 50 level. Major Support Levels – $0.3500 and $0.3440. Major Resistance Levels – $0.3580 and $0.3650.

Cardano price started a decent increase above the $0.340 resistance. ADA is now showing positive signs and might rise further toward $0.380.
- ADA price started a recovery wave from the $0.3220 level.
- The price is trading above $0.350 and the 100-hourly simple moving average.
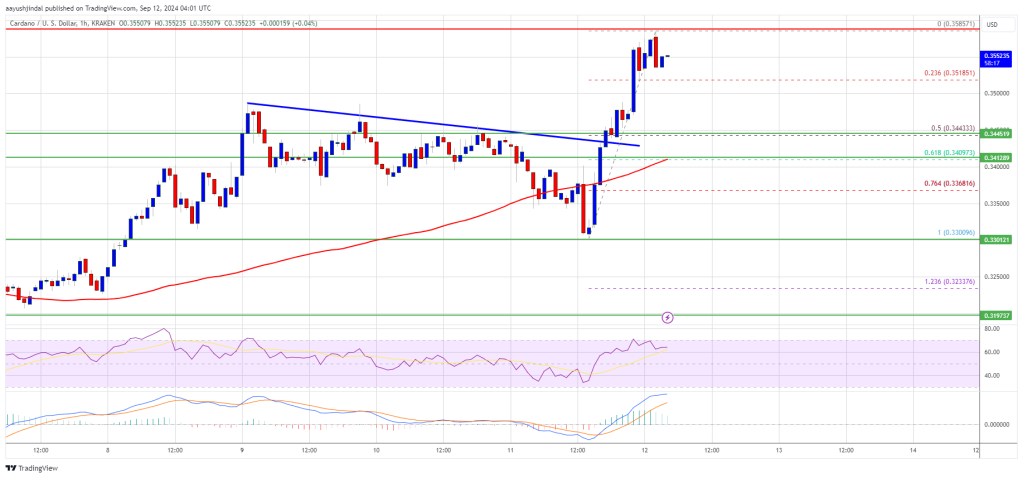
- There was a break above a key bearish trend line with resistance at $0.3430 on the hourly chart of the ADA/USD pair (data source from Kraken).
- The pair could continue to move up if it remains stable above the $0.3440 support zone.
Cardano Price Starts Steady Increase
After forming a base above the $0.330 level, Cardano started a decent increase. There was a decent move above the $0.3350 and $0.340 resistance levels like Bitcoin and Ethereum.
There was also a break above a key bearish trend line with resistance at $0.3430 on the hourly chart of the ADA/USD pair. The pair even spiked above $0.350. A high was formed at $0.3587 and the price is now consolidating gains.
It is above the 23.6% Fib retracement level of the upward move from the $0.3300 swing low to the $0.3587 high. Cardano price is now trading above $0.350 and the 100-hourly simple moving average.
On the upside, the price might face resistance near the $0.3580 zone. The first resistance is near $0.3620. The next key resistance might be $0.3650. If there is a close above the $0.3650 resistance, the price could start a strong rally. In the stated case, the price could rise toward the $0.380 region. Any more gains might call for a move toward $0.400.
Are Dips Supported in ADA?
If Cardano’s price fails to climb above the $0.3580 resistance level, it could start another decline. Immediate support on the downside is near the $0.350 level.
The next major support is near the $0.3440 level or the 50% Fib retracement level of the upward move from the $0.3300 swing low to the $0.3587 high. A downside break below the $0.3440 level could open the doors for a test of $0.330. The next major support is near the $0.320 level where the bulls might emerge.
Technical Indicators
Hourly MACD – The MACD for ADA/USD is gaining momentum in the bullish zone.
Hourly RSI (Relative Strength Index) – The RSI for ADA/USD is now above the 50 level.
Major Support Levels – $0.3500 and $0.3440.
Major Resistance Levels – $0.3580 and $0.3650.
What's Your Reaction?


.gif)