


Dogecoin Falls Below Trendline Resistance, Eyes On $0.09149 Breach
Dogecoin (DOGE) finds itself in a challenging position as bearish forces continue to dominate the market. Currently trading below a key descending trendline, DOGE faces mounting pressure that could push the price toward the critical $0.09149 support level. With the bearish trendline acting as a formidable resistance, any failure to hold this support could signal further downside movement. This article aims to provide a comprehensive analysis of Dogecoin’s current negative outlook, highlighting its position under the trendline resistance and the potential implications of a breach below the $0.09149 support level. By examining key technical indicators and market sentiment, the article seeks to offer insights into whether DOGE will continue its downward trajectory or find a reversal. With a market capitalization exceeding $14 billion and a trading volume surpassing $471 million, Dogecoin was trading at approximately $0.9683, reflecting a 1% increase at the time of writing. In the past 24 hours, its market cap has risen by 1.01%, while trading volume has declined by 3.71%. Price Action Analysis: Assessing The Downward Pressure On Dogecoin On the 4-hour chart, Dogecoin, trading below the 100-day Simple Moving Average (SMA), is exhibiting consistent bearish momentum. The cryptocurrency is currently consolidating just above the $0.09149 mark. Related Reading: Major Dogecoin Indicator Flashes Bullish, Is It Time To Buy? This consolidation near a critical support level suggests that despite brief attempts to recover, selling pressure remains dominant. If DOGE fails to maintain its position above $0.09149, it could trigger an extended decline, potentially pushing the price lower as bears continue to exert control. Additionally, on the 4-hour chart, the Relative Strength Index (RSI) is positioned at 45%, failing to rise above the 50% mark. This failure to gain traction above the midpoint reflects persistent pessimistic momentum, suggesting that downward pressure may continue, as the RSI’s position below 50% reinforces the likelihood of further bearish activity in the market. On the daily chart, Dogecoin is still demonstrating notable bearish movement below the 100-day SMA and the trendline. The cryptocurrency is currently approaching the support level at $0.09149, indicating ongoing downward pressure and the potential for more declines if this support fails to hold. Finally, the RSI signal line on the 1-day chart has fallen to 41%, slipping below the 50% threshold, reflecting a shift in momentum that could lead to additional downward movement in DOGE’s price. Potential Scenarios: What Could Happen If DOGE Breaks $0.09149? If Dogecoin breaches the $0.09149 support level, several scenarios could unfold. A successful break below this key support might intensify the downbeat trend, potentially driving DOGE toward the $0.07456 support range. Should this level be breached, the price could further decrease to test the $0.0559 support mark, and possibly explore even lower support zones. Related Reading: Dogecoin Price (DOGE) Struggles: Can It Overcome the Slump? Conversely, if Dogecoin holds above $0.09149 and reverses its decline, it could indicate a bullish turnaround, which might set the stage for a rally toward the trendline resistance. A successful break above this trendline could trigger a significant uptrend, possibly pushing DOGE toward $0.1293 and beyond. Featured image from Unsplash, chart from Tradingview.com

Dogecoin (DOGE) finds itself in a challenging position as bearish forces continue to dominate the market. Currently trading below a key descending trendline, DOGE faces mounting pressure that could push the price toward the critical $0.09149 support level. With the bearish trendline acting as a formidable resistance, any failure to hold this support could signal further downside movement.
This article aims to provide a comprehensive analysis of Dogecoin’s current negative outlook, highlighting its position under the trendline resistance and the potential implications of a breach below the $0.09149 support level. By examining key technical indicators and market sentiment, the article seeks to offer insights into whether DOGE will continue its downward trajectory or find a reversal.
With a market capitalization exceeding $14 billion and a trading volume surpassing $471 million, Dogecoin was trading at approximately $0.9683, reflecting a 1% increase at the time of writing. In the past 24 hours, its market cap has risen by 1.01%, while trading volume has declined by 3.71%.
Price Action Analysis: Assessing The Downward Pressure On Dogecoin
On the 4-hour chart, Dogecoin, trading below the 100-day Simple Moving Average (SMA), is exhibiting consistent bearish momentum. The cryptocurrency is currently consolidating just above the $0.09149 mark.
This consolidation near a critical support level suggests that despite brief attempts to recover, selling pressure remains dominant. If DOGE fails to maintain its position above $0.09149, it could trigger an extended decline, potentially pushing the price lower as bears continue to exert control.
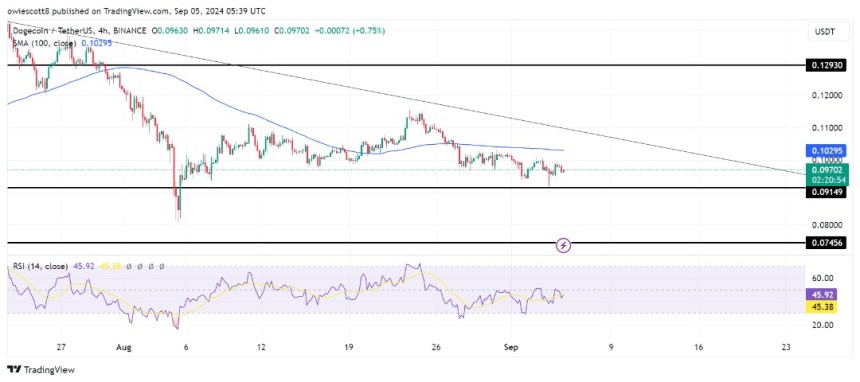
Additionally, on the 4-hour chart, the Relative Strength Index (RSI) is positioned at 45%, failing to rise above the 50% mark. This failure to gain traction above the midpoint reflects persistent pessimistic momentum, suggesting that downward pressure may continue, as the RSI’s position below 50% reinforces the likelihood of further bearish activity in the market.
On the daily chart, Dogecoin is still demonstrating notable bearish movement below the 100-day SMA and the trendline. The cryptocurrency is currently approaching the support level at $0.09149, indicating ongoing downward pressure and the potential for more declines if this support fails to hold.
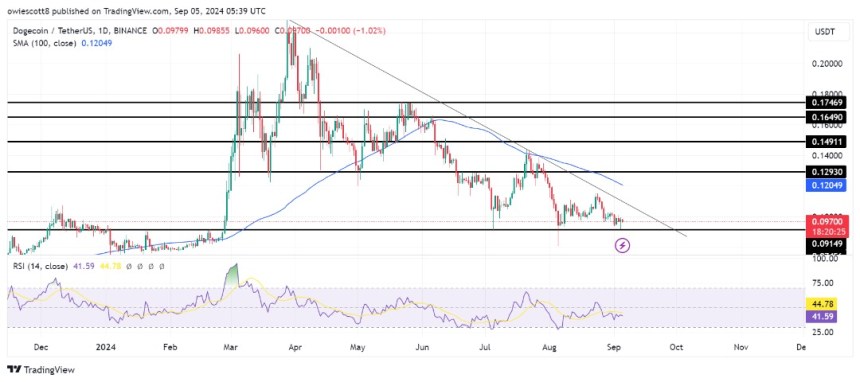
Finally, the RSI signal line on the 1-day chart has fallen to 41%, slipping below the 50% threshold, reflecting a shift in momentum that could lead to additional downward movement in DOGE’s price.
Potential Scenarios: What Could Happen If DOGE Breaks $0.09149?
If Dogecoin breaches the $0.09149 support level, several scenarios could unfold. A successful break below this key support might intensify the downbeat trend, potentially driving DOGE toward the $0.07456 support range. Should this level be breached, the price could further decrease to test the $0.0559 support mark, and possibly explore even lower support zones.
Conversely, if Dogecoin holds above $0.09149 and reverses its decline, it could indicate a bullish turnaround, which might set the stage for a rally toward the trendline resistance. A successful break above this trendline could trigger a significant uptrend, possibly pushing DOGE toward $0.1293 and beyond.
What's Your Reaction?


.gif)