


Ethereum Price Aims for Key Upside: Can Bulls Push Past $2,400?
Ethereum price is again rising and trading above $2,320. ETH must clear the $2,400 resistance to gain bullish momentum in the near term. Ethereum is attempting a recovery wave above the $2,320 zone. The price is trading above $2,350 and the 100-hourly Simple Moving Average. There was a break above a short-term declining channel with resistance at $2,350 on the hourly chart of ETH/USD (data feed via Kraken). The pair must clear the $2,400 resistance to continue higher in the near term. Ethereum Price Eyes Upside Break Ethereum price remained supported above the $2,250 level. A base was formed, and the price started another increase above the $2,300 level like Bitcoin. There was a break above a short-term declining channel with resistance at $2,350 on the hourly chart of ETH/USD. The pair even surpassed the $2,380 level, but it stayed below the $2,400 resistance level. A high is formed at $2,390 and the price is now consolidating. It is trading near the 23.6% Fib retracement level of the upward move from the $2,278 swing low to the $2,390 high. Ethereum price is now trading above $2,320 and the 100-hourly Simple Moving Average. On the upside, the price seems to be facing hurdles near the $2,380 level. The first major resistance is near the $2,400 level. A close above the $2,400 level might send Ether toward the $2,450 resistance. The next key resistance is near $2,500. An upside break above the $2,500 resistance might call for more gains toward the $2,550 resistance zone in the near term. Another Decline In ETH? If Ethereum fails to clear the $2,380 resistance, it could start another decline in the near term. Initial support on the downside is near $2,350. The first major support sits near the $2,330 zone or the 50% Fib retracement level of the upward move from the $2,278 swing low to the $2,390 high. A clear move below the $2,330 support might push the price toward $2,250. Any more losses might send the price toward the $2,200 support level in the near term. The next key support sits at $2,120. Technical Indicators Hourly MACD – The MACD for ETH/USD is losing momentum in the bullish zone. Hourly RSI – The RSI for ETH/USD is now above the 50 zone. Major Support Level – $2,330 Major Resistance Level – $2,400

Ethereum price is again rising and trading above $2,320. ETH must clear the $2,400 resistance to gain bullish momentum in the near term.
- Ethereum is attempting a recovery wave above the $2,320 zone.
- The price is trading above $2,350 and the 100-hourly Simple Moving Average.
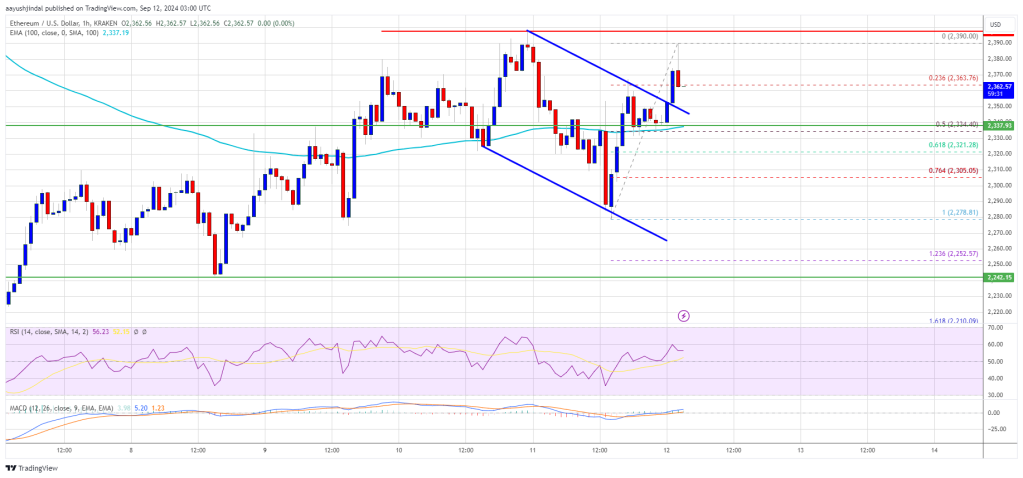
- There was a break above a short-term declining channel with resistance at $2,350 on the hourly chart of ETH/USD (data feed via Kraken).
- The pair must clear the $2,400 resistance to continue higher in the near term.
Ethereum Price Eyes Upside Break
Ethereum price remained supported above the $2,250 level. A base was formed, and the price started another increase above the $2,300 level like Bitcoin.
There was a break above a short-term declining channel with resistance at $2,350 on the hourly chart of ETH/USD. The pair even surpassed the $2,380 level, but it stayed below the $2,400 resistance level. A high is formed at $2,390 and the price is now consolidating.
It is trading near the 23.6% Fib retracement level of the upward move from the $2,278 swing low to the $2,390 high. Ethereum price is now trading above $2,320 and the 100-hourly Simple Moving Average.
On the upside, the price seems to be facing hurdles near the $2,380 level. The first major resistance is near the $2,400 level. A close above the $2,400 level might send Ether toward the $2,450 resistance. The next key resistance is near $2,500. An upside break above the $2,500 resistance might call for more gains toward the $2,550 resistance zone in the near term.
Another Decline In ETH?
If Ethereum fails to clear the $2,380 resistance, it could start another decline in the near term. Initial support on the downside is near $2,350. The first major support sits near the $2,330 zone or the 50% Fib retracement level of the upward move from the $2,278 swing low to the $2,390 high.
A clear move below the $2,330 support might push the price toward $2,250. Any more losses might send the price toward the $2,200 support level in the near term. The next key support sits at $2,120.
Technical Indicators
Hourly MACD – The MACD for ETH/USD is losing momentum in the bullish zone.
Hourly RSI – The RSI for ETH/USD is now above the 50 zone.
Major Support Level – $2,330
Major Resistance Level – $2,400
What's Your Reaction?


.gif)
