


Ethereum Price Nosedives Over 5%, Pressure Mounts on Bulls
Ethereum price is down over 5% and trading below $2,350l. ETH is signaling an increase in selling pressure and might drop to $2,120. Ethereum started another decline after it failed to clear $2,450. The price is trading below $2,320 and the 100-hourly Simple Moving Average. There was a break below a key bullish trend line with support at $2,400 on the hourly chart of ETH/USD (data feed via Kraken). The pair must clear the $2,320 resistance to start a recovery wave in the near term. Ethereum Price Dips Again Ethereum price failed to clear the $2,450 resistance and started another decline like Bitcoin. ETH declined more than BTC and broke key supports at $2,400. There was a break below a key bullish trend line with support at $2,400 on the hourly chart of ETH/USD. The pair is down over 5% and there was a move below the $2,320 support zone. A low is formed at $2,253 and the price is now consolidating losses. Ethereum price is now trading below $2,320 and the 100-hourly Simple Moving Average. On the upside, the price seems to be facing hurdles near the $2,300 level or the 23.6% Fib retracement level of the downward move from the $2,465 swing high to the $2,253 low. The first major resistance is near the $2,320 level. A close above the $2,320 level might send Ether toward the $2,360 resistance. The next key resistance is near $2,385 or the 61.8% Fib retracement level of the downward move from the $2,465 swing high to the $2,253 low. An upside break above the $2,385 resistance might call for more gains toward the $2,450 resistance zone in the near term. More Downsides In ETH? If Ethereum fails to clear the $2,320 resistance, it could start another decline in the near term. Initial support on the downside is near $2,250. The first major support sits near the $2,200 zone. A clear move below the $2,200 support might push the price toward $2,150. Any more losses might send the price toward the $2,120 support level in the near term. The next key support sits at $2,050. Technical Indicators Hourly MACD – The MACD for ETH/USD is gaining momentum in the bearish zone. Hourly RSI – The RSI for ETH/USD is now below the 50 zone. Major Support Level – $2,250 Major Resistance Level – $2,320

Ethereum price is down over 5% and trading below $2,350l. ETH is signaling an increase in selling pressure and might drop to $2,120.
- Ethereum started another decline after it failed to clear $2,450.
- The price is trading below $2,320 and the 100-hourly Simple Moving Average.
- There was a break below a key bullish trend line with support at $2,400 on the hourly chart of ETH/USD (data feed via Kraken).
- The pair must clear the $2,320 resistance to start a recovery wave in the near term.
Ethereum Price Dips Again
Ethereum price failed to clear the $2,450 resistance and started another decline like Bitcoin. ETH declined more than BTC and broke key supports at $2,400.
There was a break below a key bullish trend line with support at $2,400 on the hourly chart of ETH/USD. The pair is down over 5% and there was a move below the $2,320 support zone. A low is formed at $2,253 and the price is now consolidating losses.
Ethereum price is now trading below $2,320 and the 100-hourly Simple Moving Average. On the upside, the price seems to be facing hurdles near the $2,300 level or the 23.6% Fib retracement level of the downward move from the $2,465 swing high to the $2,253 low.
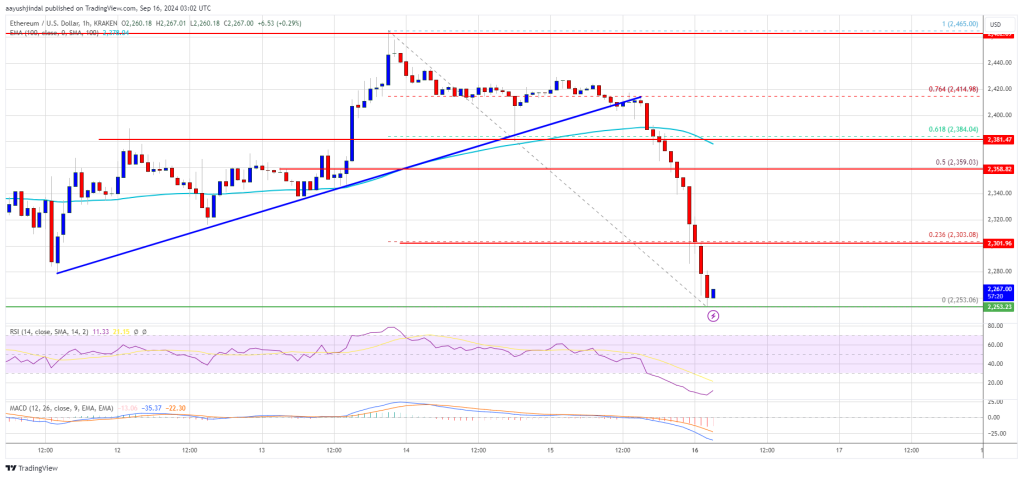
The first major resistance is near the $2,320 level. A close above the $2,320 level might send Ether toward the $2,360 resistance. The next key resistance is near $2,385 or the 61.8% Fib retracement level of the downward move from the $2,465 swing high to the $2,253 low. An upside break above the $2,385 resistance might call for more gains toward the $2,450 resistance zone in the near term.
More Downsides In ETH?
If Ethereum fails to clear the $2,320 resistance, it could start another decline in the near term. Initial support on the downside is near $2,250. The first major support sits near the $2,200 zone.
A clear move below the $2,200 support might push the price toward $2,150. Any more losses might send the price toward the $2,120 support level in the near term. The next key support sits at $2,050.
Technical Indicators
Hourly MACD – The MACD for ETH/USD is gaining momentum in the bearish zone.
Hourly RSI – The RSI for ETH/USD is now below the 50 zone.
Major Support Level – $2,250
Major Resistance Level – $2,320
What's Your Reaction?


.gif)