


Ethereum Price Recovers Higher But Lacks Bullish Drive To Test $2,500
Ethereum price is attempting a recovery wave above $2,320. ETH might struggle to gain pace for a move toward the $2,500 resistance zone. Ethereum is attempting a recovery wave above the $2,250 zone. The price is trading above $2,320 and the 100-hourly Simple Moving Average. There is a connecting bullish trend line forming with support at $2,320 on the hourly chart of ETH/USD (data feed via Kraken). The pair must clear the $2,400 resistance to continue higher in the near term. Ethereum Price Recovers Above $2,320 Ethereum price started a recovery wave above the $2,250 level. ETH was able to clear the $2,280 resistance zone to move into a positive zone, but momentum was weak compared to Bitcoin. There was a move above the 50% Fib retracement level of the downward move from the $2,488 swing high to the $2,150 low. The bulls were able to push the price above the $2,320 resistance zone. The price even spiked above the $2,350 level. Ethereum price is now trading above $2,320 and the 100-hourly Simple Moving Average. There is also a connecting bullish trend line forming with support at $2,320 on the hourly chart of ETH/USD. On the upside, the price seems to be facing hurdles near the $2,375 level. The first major resistance is near the $2,400 level or the 76.4% Fib retracement level of the downward move from the $2,488 swing high to the $2,150 low. A close above the $2,400 level might send Ether toward the $2,450 resistance. The next key resistance is near $2,500. An upside break above the $2,500 resistance might send the price higher toward the $2,550 resistance zone in the near term. Another Decline In ETH? If Ethereum fails to clear the $2,400 resistance, it could start another decline. Initial support on the downside is near $2,320 and the trend line. The first major support sits near the $2,240 zone. A clear move below the $2,240 support might push the price toward $2,150. Any more losses might send the price toward the $2,050 support level in the near term. The next key support sits at $2,000. Technical Indicators Hourly MACD – The MACD for ETH/USD is losing momentum in the bullish zone. Hourly RSI – The RSI for ETH/USD is now above the 50 zone. Major Support Level – $2,320 Major Resistance Level – $2,400

Ethereum price is attempting a recovery wave above $2,320. ETH might struggle to gain pace for a move toward the $2,500 resistance zone.
- Ethereum is attempting a recovery wave above the $2,250 zone.
- The price is trading above $2,320 and the 100-hourly Simple Moving Average.
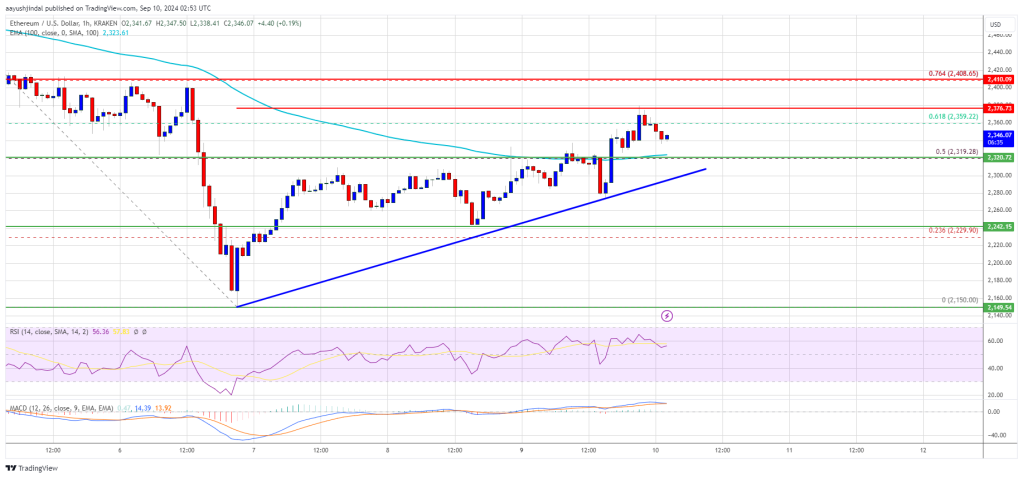
- There is a connecting bullish trend line forming with support at $2,320 on the hourly chart of ETH/USD (data feed via Kraken).
- The pair must clear the $2,400 resistance to continue higher in the near term.
Ethereum Price Recovers Above $2,320
Ethereum price started a recovery wave above the $2,250 level. ETH was able to clear the $2,280 resistance zone to move into a positive zone, but momentum was weak compared to Bitcoin.
There was a move above the 50% Fib retracement level of the downward move from the $2,488 swing high to the $2,150 low. The bulls were able to push the price above the $2,320 resistance zone. The price even spiked above the $2,350 level.
Ethereum price is now trading above $2,320 and the 100-hourly Simple Moving Average. There is also a connecting bullish trend line forming with support at $2,320 on the hourly chart of ETH/USD.
On the upside, the price seems to be facing hurdles near the $2,375 level. The first major resistance is near the $2,400 level or the 76.4% Fib retracement level of the downward move from the $2,488 swing high to the $2,150 low. A close above the $2,400 level might send Ether toward the $2,450 resistance.
The next key resistance is near $2,500. An upside break above the $2,500 resistance might send the price higher toward the $2,550 resistance zone in the near term.
Another Decline In ETH?
If Ethereum fails to clear the $2,400 resistance, it could start another decline. Initial support on the downside is near $2,320 and the trend line. The first major support sits near the $2,240 zone.
A clear move below the $2,240 support might push the price toward $2,150. Any more losses might send the price toward the $2,050 support level in the near term. The next key support sits at $2,000.
Technical Indicators
Hourly MACD – The MACD for ETH/USD is losing momentum in the bullish zone.
Hourly RSI – The RSI for ETH/USD is now above the 50 zone.
Major Support Level – $2,320
Major Resistance Level – $2,400
What's Your Reaction?


.gif)