


Solana Hits Critical $137 Support: Can Bulls Prevent A Breakdown?
Solana has hit the key $137 support level, and the bulls are now facing intense pressure to prevent a downward breakout. With the market momentum hanging in the balance, all eyes are on whether the bulls can defend this critical zone and spark a potential rebound. A strong defense at this level could signal renewed bullish strength, while a breakdown could pave the way for further declines. As traders anticipate Solana’s next move, this article aims to explore its crucial test at the $137 support level, focusing on whether the bulls can withstand increasing pressure. It will evaluate the potential for either a breakout or a rebound, offering insights into SOL’s short-term price direction by delving into key technical indicators and market sentiment. Analyzing the RSI And Moving Averages: Bullish Or Bearish Outlook? Recently, after struggling to break above the $164 resistance level, Solana has adopted a negative trajectory on the 4-hour chart. The price is currently trading below the 100-day Simple Moving Average (SMA), suggesting a shift in market sentiment, as SOL now targets a potential bearish breakout at the $137 level. If the price continues to decline and breaches this support, it could trigger extended selling pressure and open the door to additional losses. Also, an analysis of the 4-hour Relative Strength Index (RSI) reveals that the RSI has fallen to around 33%, indicating that the buying pressure is diminishing, reflecting a shift in market dynamics. An RSI below 40% often signifies that an asset may be entering oversold territory, which can lead to potential further declines. Related Reading: Solana (SOL) Failure To Break $154 Could Lead To $85 Correction – Analyst On the daily chart, SOL is displaying notable negative movement, evident from a series of bearish candlesticks. This persistent downward trend underscores the prevailing selling pressure in the market, indicating that bears are firmly in control. Additionally, Solana is trading below the 100-day SMA, suggesting a lack of bullish momentum and reinforcing the likelihood of continued declines. Finally, on the 1-day chart, a closer look at the RSI formation shows that the RSI signal line has fallen to 43%, having recently breached the crucial 50% threshold. An RSI reading below 50 typically reflects a bearish sentiment, signaling that the asset is losing strength. Such a drop could imply further downside potential for SOL unless a reversal occurs. Key Support Level At $137: Can Solana Bulls Hold The Line? The $137 support level is crucial for Solana, representing a significant battleground between bulls and bears. If bulls succeed in defending this support, it could instill confidence in the market and pave the way for a potential recovery toward the $164 resistance level. Related Reading: Solana (SOL) Could Crash 40% If It Stays Below $140 – Top Analyst Shares Insights Nonetheless, a breach below the $137 support level could trigger significant selling pressure, resulting in additional declines toward the $118 support level. When this level is breached, it may lead to more losses, with potential targets including lower support areas around the $99 mark. Such a scenario would intensify bearish sentiment and could lead to a more pronounced downtrend in Solana’s price. Featured image from Unsplash, chart from Tradingview.com

Solana has hit the key $137 support level, and the bulls are now facing intense pressure to prevent a downward breakout. With the market momentum hanging in the balance, all eyes are on whether the bulls can defend this critical zone and spark a potential rebound. A strong defense at this level could signal renewed bullish strength, while a breakdown could pave the way for further declines.
As traders anticipate Solana’s next move, this article aims to explore its crucial test at the $137 support level, focusing on whether the bulls can withstand increasing pressure. It will evaluate the potential for either a breakout or a rebound, offering insights into SOL’s short-term price direction by delving into key technical indicators and market sentiment.
Analyzing the RSI And Moving Averages: Bullish Or Bearish Outlook?
Recently, after struggling to break above the $164 resistance level, Solana has adopted a negative trajectory on the 4-hour chart. The price is currently trading below the 100-day Simple Moving Average (SMA), suggesting a shift in market sentiment, as SOL now targets a potential bearish breakout at the $137 level. If the price continues to decline and breaches this support, it could trigger extended selling pressure and open the door to additional losses.

Also, an analysis of the 4-hour Relative Strength Index (RSI) reveals that the RSI has fallen to around 33%, indicating that the buying pressure is diminishing, reflecting a shift in market dynamics. An RSI below 40% often signifies that an asset may be entering oversold territory, which can lead to potential further declines.
On the daily chart, SOL is displaying notable negative movement, evident from a series of bearish candlesticks. This persistent downward trend underscores the prevailing selling pressure in the market, indicating that bears are firmly in control. Additionally, Solana is trading below the 100-day SMA, suggesting a lack of bullish momentum and reinforcing the likelihood of continued declines.
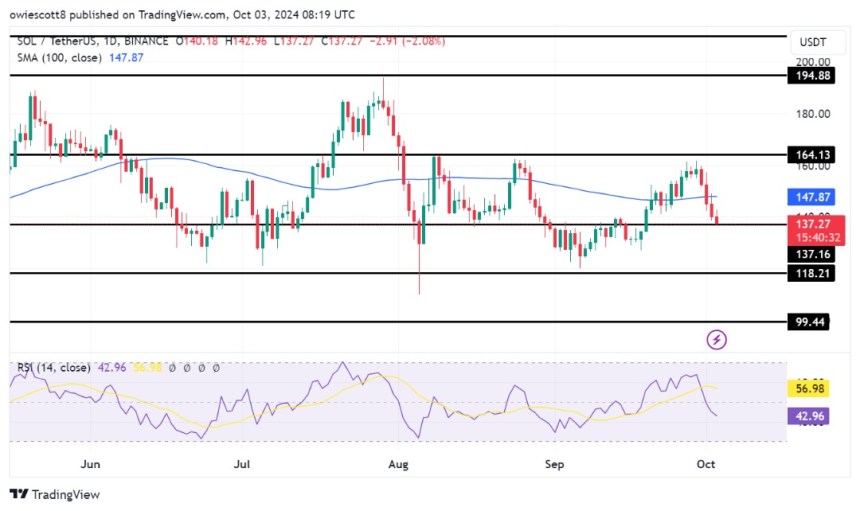
Finally, on the 1-day chart, a closer look at the RSI formation shows that the RSI signal line has fallen to 43%, having recently breached the crucial 50% threshold. An RSI reading below 50 typically reflects a bearish sentiment, signaling that the asset is losing strength. Such a drop could imply further downside potential for SOL unless a reversal occurs.
Key Support Level At $137: Can Solana Bulls Hold The Line?
The $137 support level is crucial for Solana, representing a significant battleground between bulls and bears. If bulls succeed in defending this support, it could instill confidence in the market and pave the way for a potential recovery toward the $164 resistance level.
Nonetheless, a breach below the $137 support level could trigger significant selling pressure, resulting in additional declines toward the $118 support level. When this level is breached, it may lead to more losses, with potential targets including lower support areas around the $99 mark. Such a scenario would intensify bearish sentiment and could lead to a more pronounced downtrend in Solana’s price.
What's Your Reaction?


.gif)