


Analyst Says Dogecoin Could Skyrocket 16% Any Moment
Two respected crypto analysts, Ali Martinez (@ali_charts) and CW (@CW8900), have each published technical charts indicating that Dogecoin (DOGE) appears poised for a significant price move. Their analyses, while conducted on different timeframes, both highlight breakouts from constrictive patterns that have prevented any major swings over the last few weeks. Dogecoin Could Surge 16% (1-Hour Chart) Ali Martinez presented a one-hour Dogecoin chart on X that shows the token trading within a narrowing range defined by a symmetrical triangle. According to Martinez, DOGE initially saw a steep decline—approximately 16.46%—from around $0.18, dropping just above $0.14 before recovering and forming progressively higher lows. The upper limit of the triangle rests near $0.18, while the lower support line extends upward from the vicinity of $0.144. Martinez points to the $0.16–$0.18 corridor as a key area that has contained Dogecoin’s price action. He remarks that a clear and convincing hourly close above this zone might release the buying pressure that has been consolidating over the past ten days. Citing symmetrical triangle theory, Martinez estimates that such a breakout could spark a 16% upswing from the breakout point. “Dogecoin will break out! A close outside $0.16-$0.18 could trigger a 16% price move,” Martinez wrote via X. Related Reading: Dogecoin Shark & Whale Population Rises—Price Turnaround Incoming? Falling Wedge Breakout (1-Day Chart) CW, on the other hand, shared a daily Dogecoin chart illustrating what he interprets as a falling wedge formation stretching back to December 2024, when DOGE briefly climbed to around $0.48 before reversing course into a prolonged downtrend. In a falling wedge, the price typically forms lower highs and lower lows, converging toward a narrowing apex. CW notes that Dogecoin has finally crossed above the wedge’s downward-sloping resistance line yesterday, an event widely viewed as a bullish reversal signal once the breakout is confirmed by subsequent candles holding above that line. Related Reading: Dogecoin At Make-Or-Break Point After Multi-Year Trendline Test CW’s analysis relies heavily on Fibonacci retracements drawn from DOGE’s most recent major upswing. He identifies crucial Fibonacci levels at $0.2027 (the 0.236 retracement), $0.2564 (the 0.382 retracement), $0.2999 (the 0.5 retracement), $0.3433 (the 0.618 retracement), $0.40513 (the 0.786 retracement), and $0.4839 (the 1.0 retracement). These levels often serve as potential price floors or ceilings in either bullish or bearish market environments. CW believes that now that the token has escaped its descending wedge, it could climb through these retracement levels in succession, provided the broader market remains supportive. Ultimately, he sets his sights on the 1.618 Fibonacci extension at $0.71. At press time, DOGE traded at $0.17. Featured image created with DALL.E, chart from TradingView.com

Two respected crypto analysts, Ali Martinez (@ali_charts) and CW (@CW8900), have each published technical charts indicating that Dogecoin (DOGE) appears poised for a significant price move. Their analyses, while conducted on different timeframes, both highlight breakouts from constrictive patterns that have prevented any major swings over the last few weeks.
Dogecoin Could Surge 16% (1-Hour Chart)
Ali Martinez presented a one-hour Dogecoin chart on X that shows the token trading within a narrowing range defined by a symmetrical triangle. According to Martinez, DOGE initially saw a steep decline—approximately 16.46%—from around $0.18, dropping just above $0.14 before recovering and forming progressively higher lows.
The upper limit of the triangle rests near $0.18, while the lower support line extends upward from the vicinity of $0.144. Martinez points to the $0.16–$0.18 corridor as a key area that has contained Dogecoin’s price action.
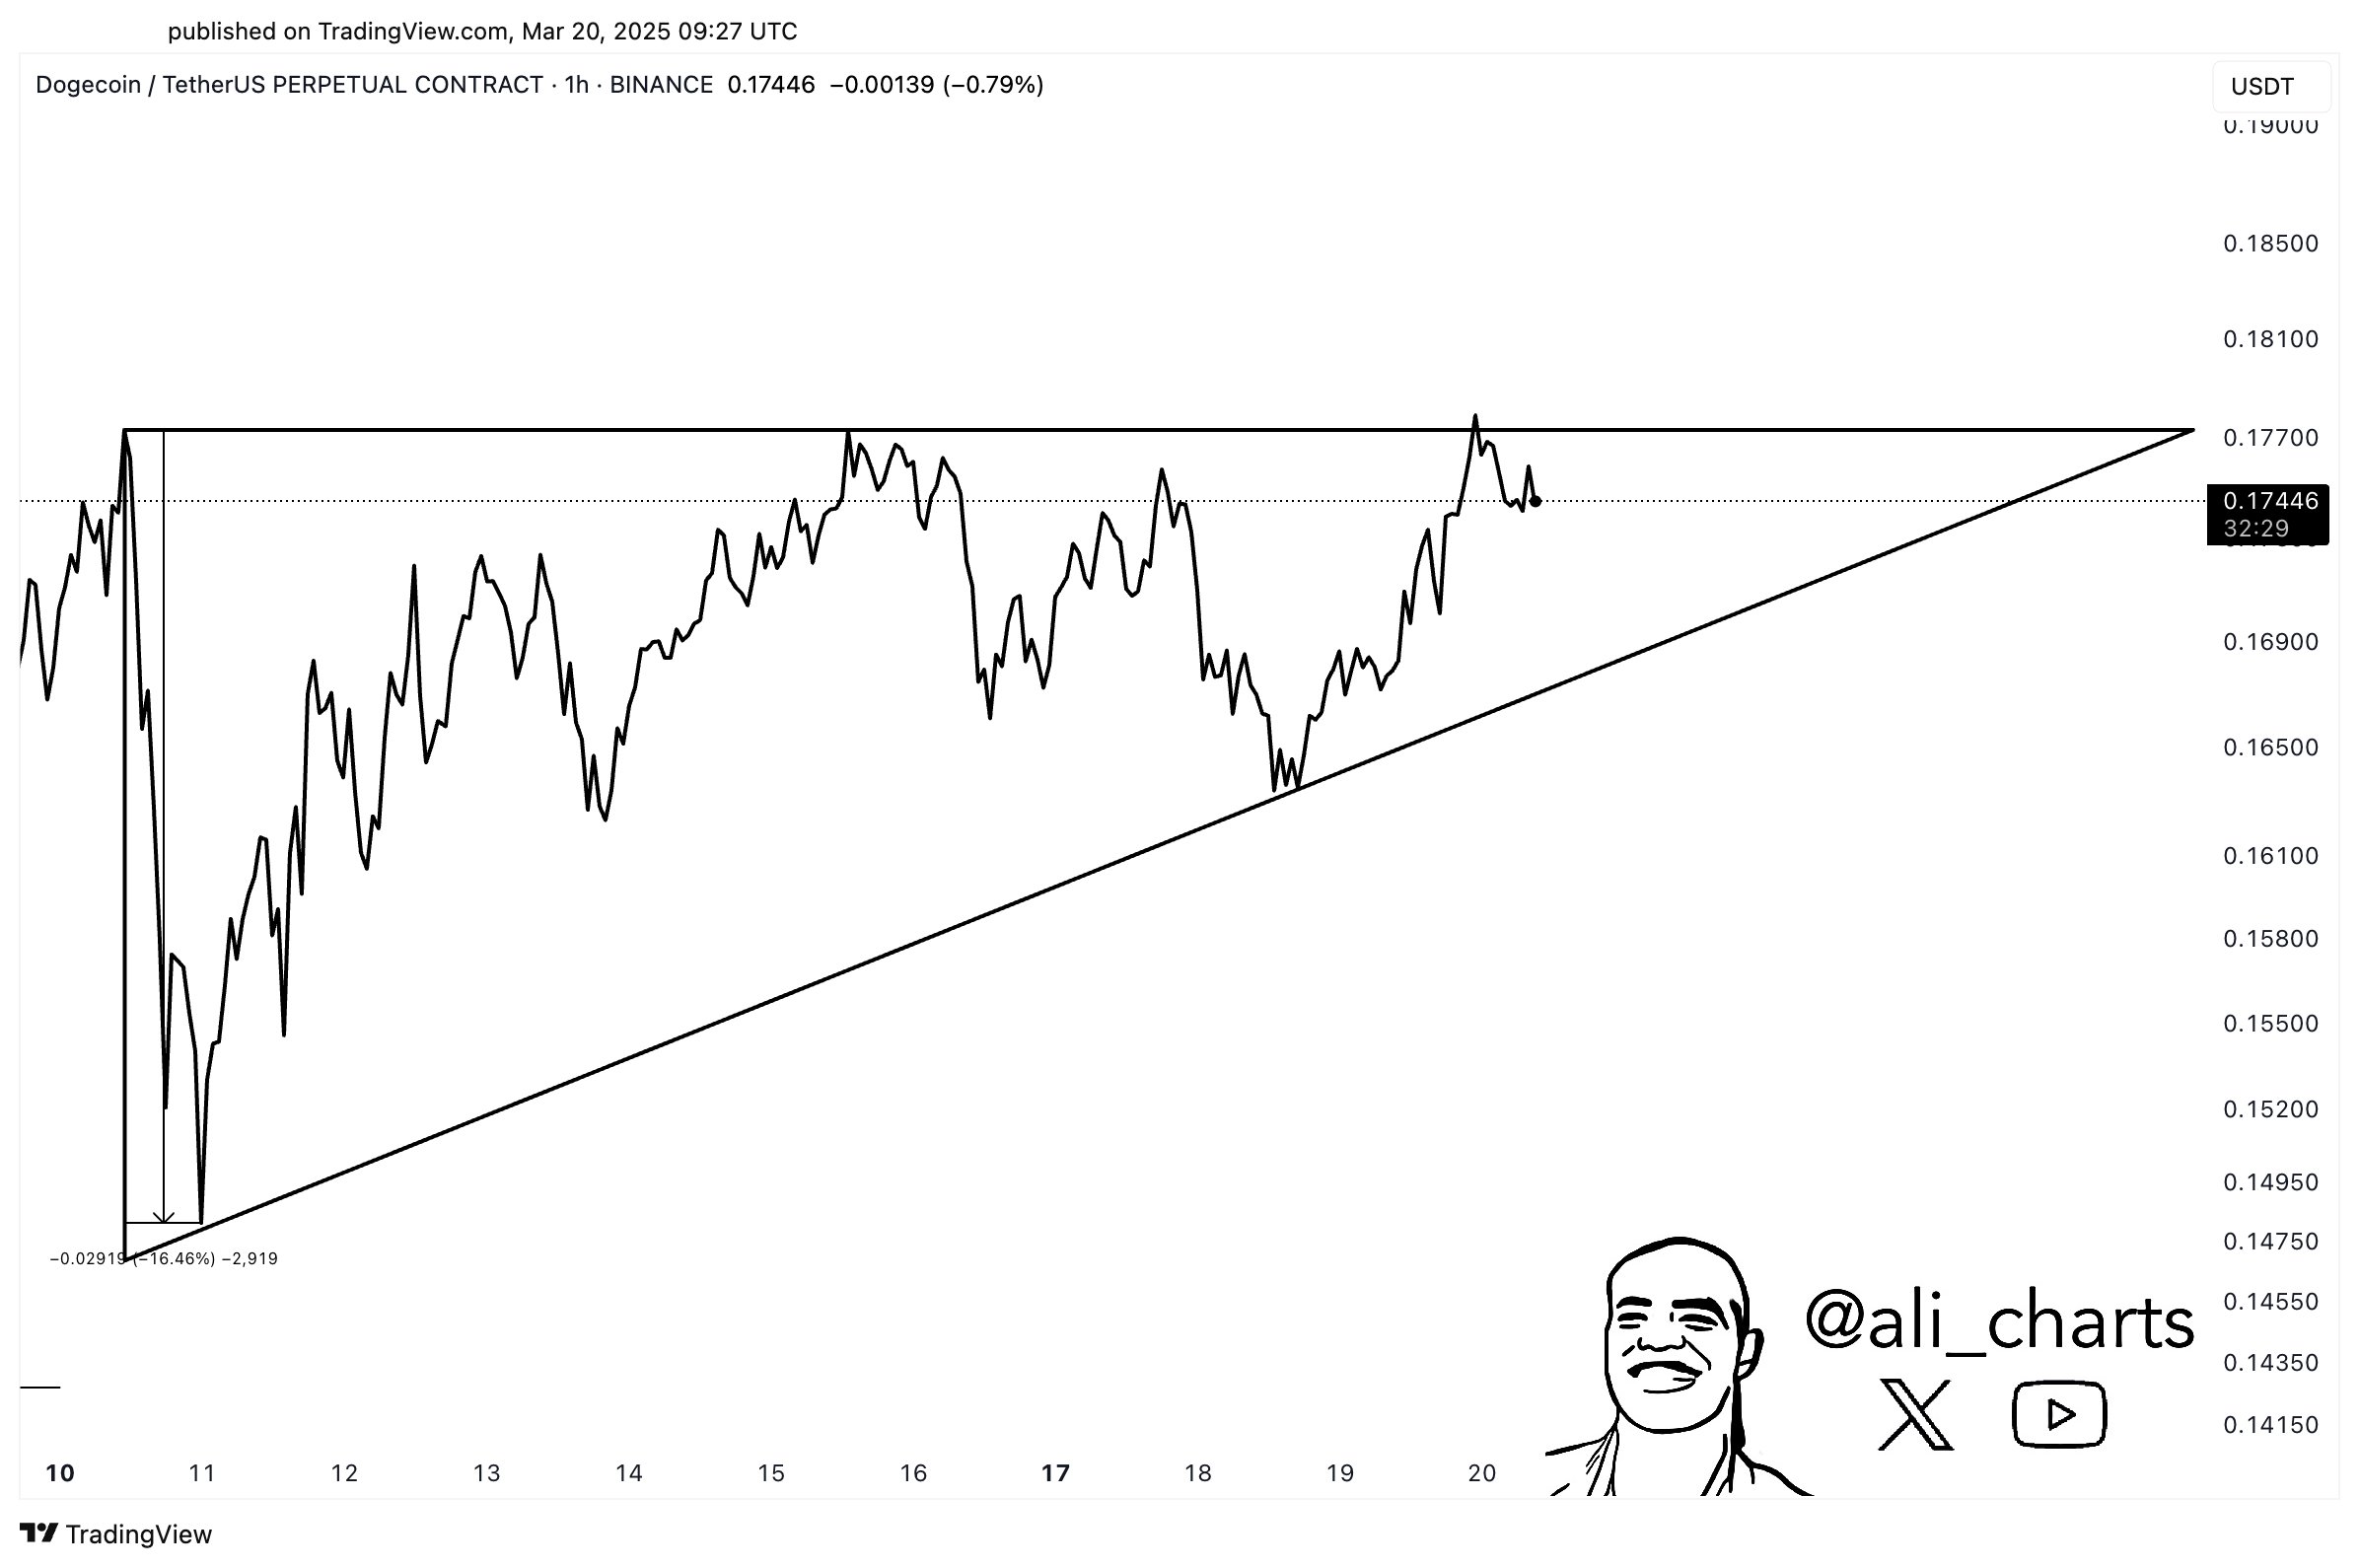
He remarks that a clear and convincing hourly close above this zone might release the buying pressure that has been consolidating over the past ten days. Citing symmetrical triangle theory, Martinez estimates that such a breakout could spark a 16% upswing from the breakout point. “Dogecoin will break out! A close outside $0.16-$0.18 could trigger a 16% price move,” Martinez wrote via X.
Falling Wedge Breakout (1-Day Chart)
CW, on the other hand, shared a daily Dogecoin chart illustrating what he interprets as a falling wedge formation stretching back to December 2024, when DOGE briefly climbed to around $0.48 before reversing course into a prolonged downtrend.
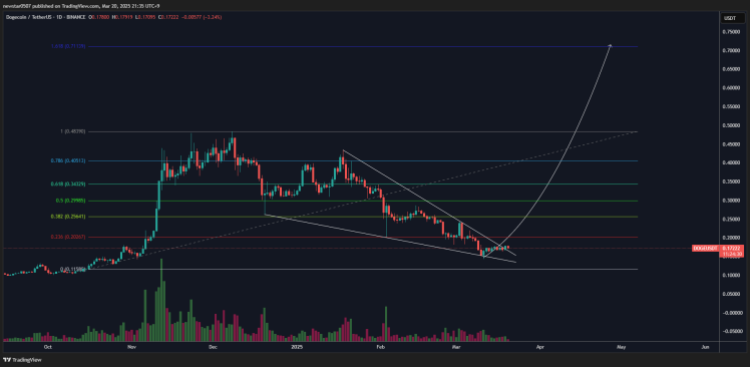
In a falling wedge, the price typically forms lower highs and lower lows, converging toward a narrowing apex. CW notes that Dogecoin has finally crossed above the wedge’s downward-sloping resistance line yesterday, an event widely viewed as a bullish reversal signal once the breakout is confirmed by subsequent candles holding above that line.
CW’s analysis relies heavily on Fibonacci retracements drawn from DOGE’s most recent major upswing. He identifies crucial Fibonacci levels at $0.2027 (the 0.236 retracement), $0.2564 (the 0.382 retracement), $0.2999 (the 0.5 retracement), $0.3433 (the 0.618 retracement), $0.40513 (the 0.786 retracement), and $0.4839 (the 1.0 retracement).
These levels often serve as potential price floors or ceilings in either bullish or bearish market environments. CW believes that now that the token has escaped its descending wedge, it could climb through these retracement levels in succession, provided the broader market remains supportive. Ultimately, he sets his sights on the 1.618 Fibonacci extension at $0.71.
At press time, DOGE traded at $0.17.
What's Your Reaction?


.gif)